Wednesday, 13 May 2015
Graphical Representation of Milestones
Graphical Representation of Milestones
Posted on May 14, 2015 by Krish.
In project planning and project management there is one viewpoint that we often overlooked which is to declutter in order to communicate effectively. This mission became even more crucial when we present the ideas to various project stakeholders who might come from different backgrounds and fields.
The use of graphical illustration or visual representation of the schedule is strongly recommended especially when the target audience of the schedule is upper level management and external stakeholders. The most common display option that comes to our mind is the summary table, Gantt chart and network diagram.
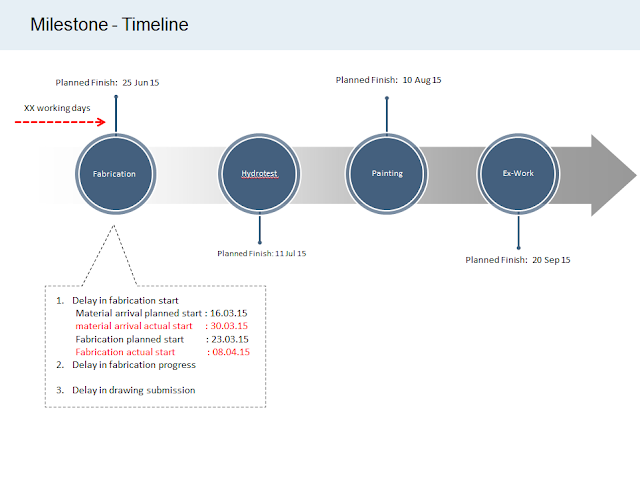
What I’m having here is another display option for representing project milestone. If you find this interesting do write to us atignitetribes@gmail.com for the softcopy.


